Variable visualisation now available on ESS Data Portal
Users of the European Social Survey (ESS) Data Portal can now view weighted results for individual questions without having to download data.
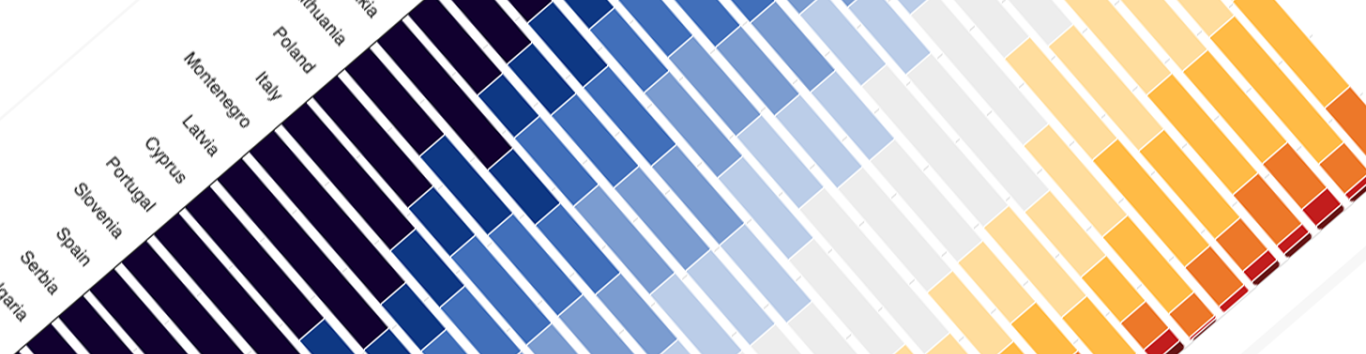
The Variable Viewer tool allows users to view results of survey questions in a bar chart, map and data table by simply selecting a survey question from the list of variables in each round.
Once the variable is selected in the ESS Data Portal, users are presented with a bar chart that includes the results of all participating countries arranged in order of mean, by highest to lowest.
This bar chart includes the percentage breakdown for each response option, in each country, with the data underpinning the graph available to view by selecting View data table from the dropdown menu.
Other options for the bar chart from the dropdown menu include Download PNG, Download PDF, Download SVG and Download XLSX.
Users can also view the bar chart in full screen, send to print, share on social media channels (Facebook, LinkedIn and X) or use the HTML code to embed the graph on a website.
For each variable, a map of the results - colour-coded by mean scores - is also available. This can also be downloaded in various file formats or shared online.
At the bottom of each variable on the Data Portal is detailed information, including the full question asked and unweighted results for all respondents - showing the n= and percentages for all response options.
By selecting the Analysis option at the top of the page, users can also view variables combined with other questions for each country.
It is worth noting that the Variable Visualisation option is only available for each Round 10 (2020-22) file: countries that collected data in different modes must be viewed separately (face-to-face and self-completion).
Variable visualisation is part of a raft of improvements to the Data Portal made since the tool was launched in 2022.
This new data portal has been developed by ESS Core Scientific Team (CST) member, Sikt - Norwegian Agency for Shared Services in Education and Research (previously NSD).
Users can still download data by logging into the Data Portal and selecting the option to download data in CSV, SPSS and Stata formats.
The Datafile Builder (Wizard) allows users to create a bespoke file of data by selecting from countries, round(s) of data collected and/or variables/questions.
Multilevel data - contextual information collected from a range of external sources and linked to ESS - is available for rounds 4-9 (2008-19).
Collected as part of a Horizon 2020 project, EOSC Future data combines environmental statistics with data measuring attitudes and behaviours to support scientific analysis.
CROss-National Online Survey (CRONOS) data is also available for download. This includes data collected in three countries from 2016-18 (CRONOS-1) and panel data collected in 12 countries from 2021-23 (CRONOS-2) on a wide range of topics.
More information on the world’s first large scale, cross-national, probability-based input-harmonised web panel is available here.
Media enquiries
Stefan Swift
stefan.swift@city.ac.uk
T: +44 (0)207 0404907